Pipeline Validation
Pipeline leak detection tool by IntelliFlux Controls. Inc
Role: Product Manager, UX designer
Background
As a process engineering software company, IntelliFlux controls has delivered APPRICOT software for fortune 500+ water and chemical processing companies. In addition to the existing decision automation using Digital Twin model, the company planned to develop a software interface web tool, the shows the real time conditions of a plant.
User Personas
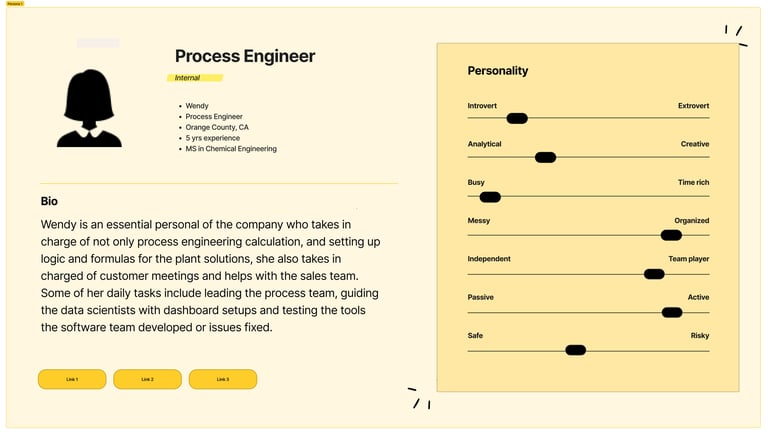
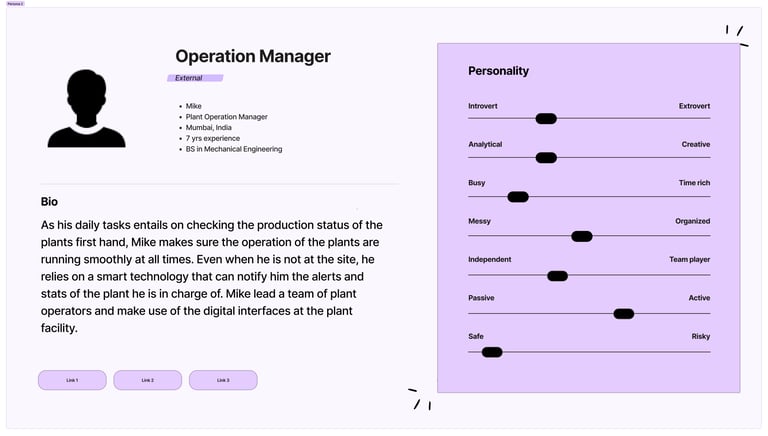
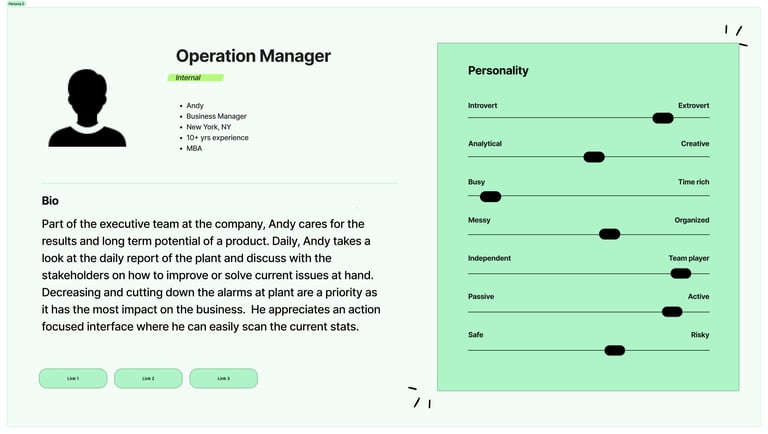
The main user personas for the product include both internal and external users. Process Engineers and Data Scientists are some of the internal users that will upload and test most of the existing database for existing and upcoming projects. The external users like plant operators and executives (plant managers mostly) on the client side will be using the interface to check frenquently on the general plant condition and leak potential.



Early Sketches
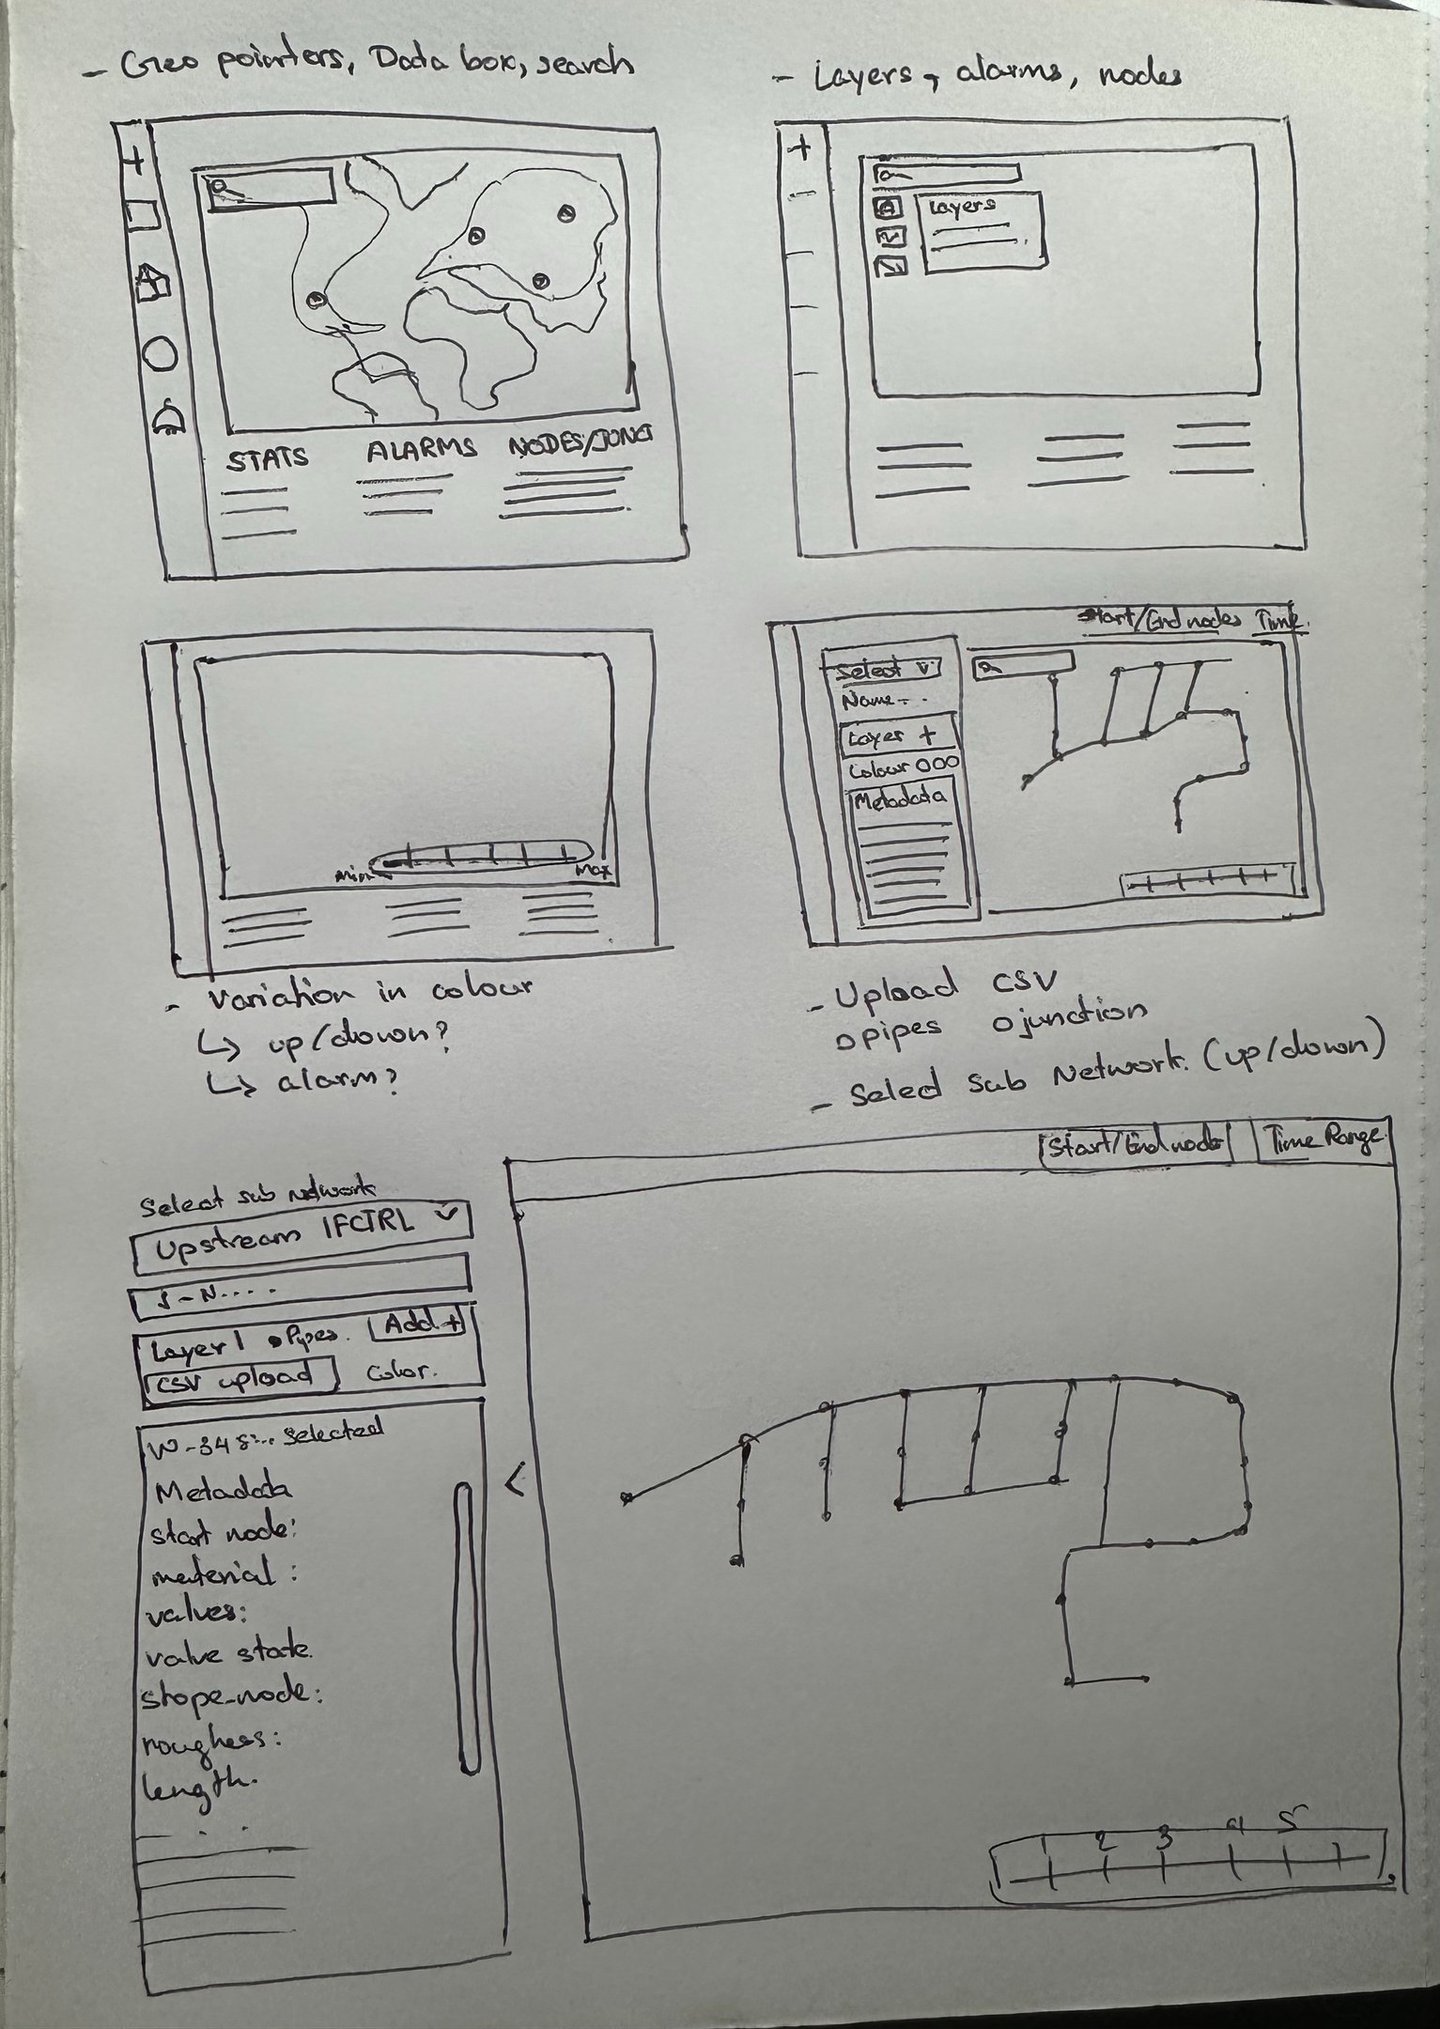
After the initial discussion with the VP of technology, process engineers and the CEO himself, I started the initial sketches on the key features. We explored a couple of ways to present the detection interface tool with the priority on being informative and easy to digest real-time plant information. The prototype of metadata on the left is added later as I iterate on the design choices.

Mid-Fidelity Prototype
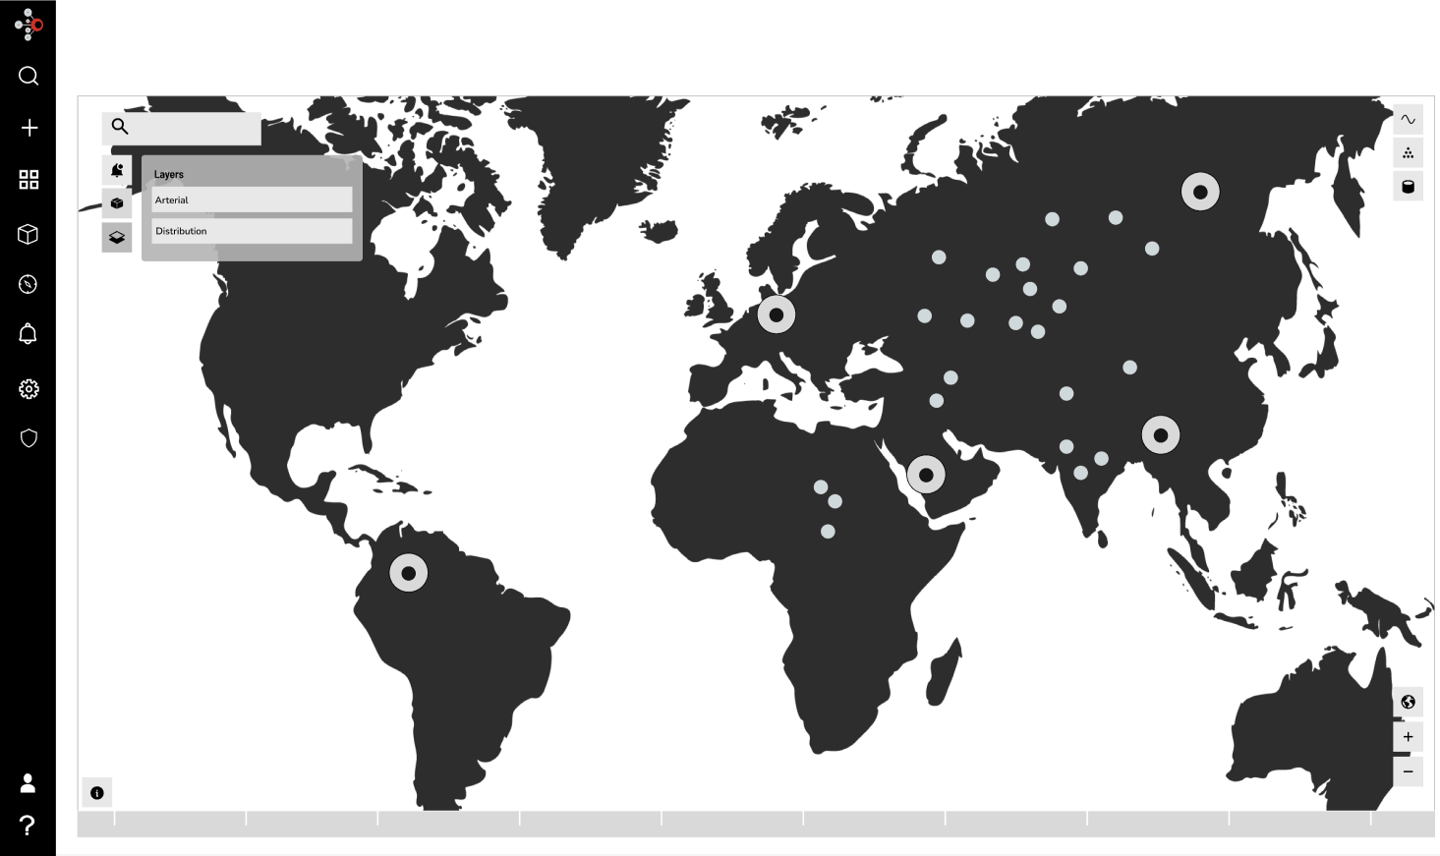
Due to the nature of time constraints, using Figma, I build the mid-fidelity prototype of geo-based location display tool on the first layout choice. The purpose is to create an interface that display the respective information of pipeline through a simple pointer. However, the team later concluded that this layout with the spread-out information in different corners might be more suitable in other Geomaps related product that focus on a bigger geographical information.


High Fidelity Prototype
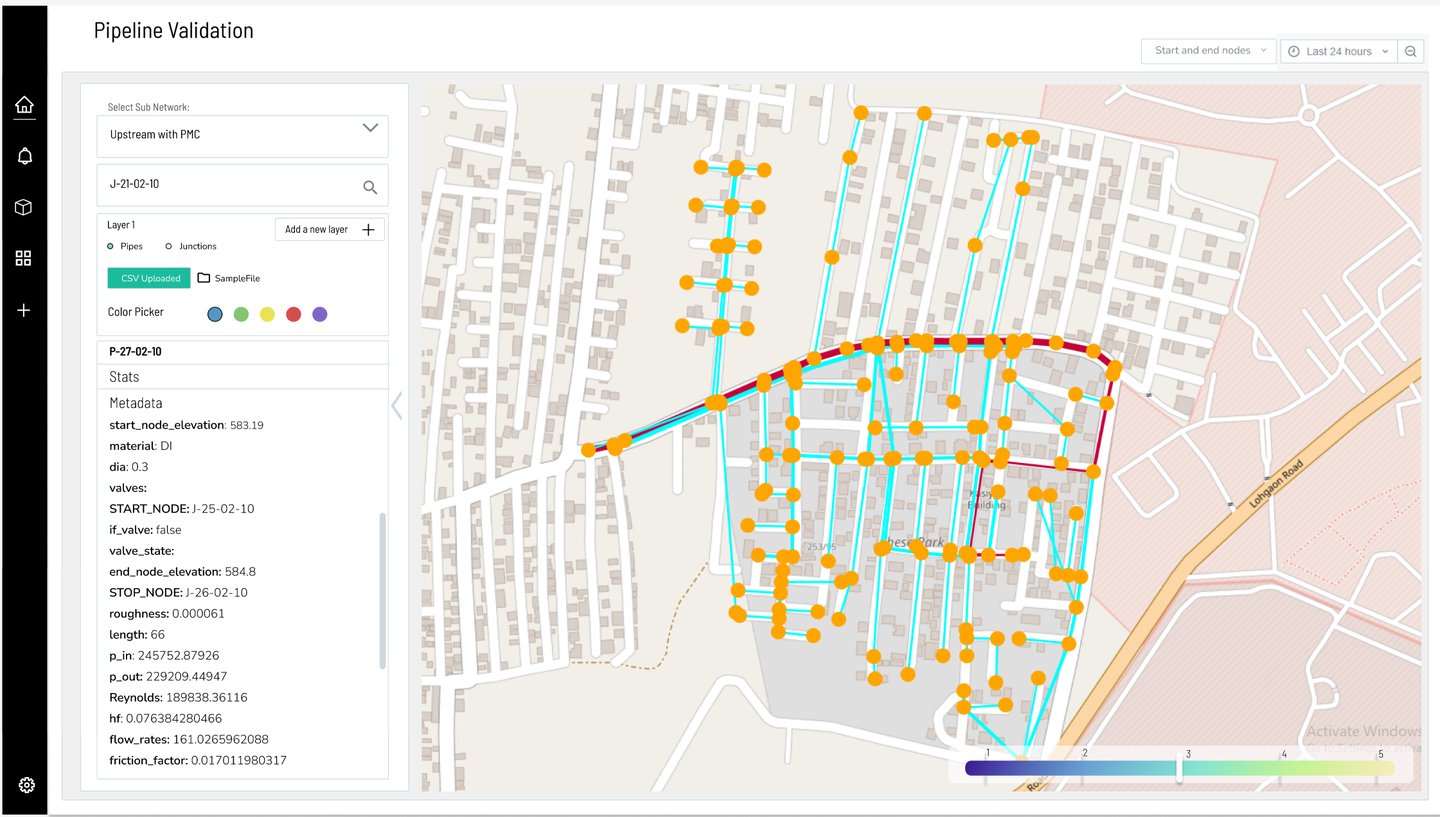
The preferred choice of personas: process engineers, plant managers, and some executive level managers is to view all the stats in one place. Additionally, from the discussion with development team, I concluded that making a 2D map in combination with Open Street Map will save time and promote efficiency.
The final prototype was created after revising the MVPS and several rounds of discussions with developers on the limitations on building GeoJSON. As a first step of the tool, a JSON file upload is required to input data. Then, the pop-up window allows a drop-down selection on several features such as upstream/downstream to view the map accordingly.