Plant Health & Management
The Plant Health & Production Report Tool by APRICOT is an AI-powered digital operator interface that gives water and chemical plants real-time visibility into production, costs, and equipment health. By unifying live performance data with predictive maintenance insights, it helps operators cut downtime, lower expenses, and extend asset life. From alarms to financial impact, everything is translated into clear, actionable reports—empowering Fortune 500 companies to run smarter, safer, and more cost-efficient plants.

Problem
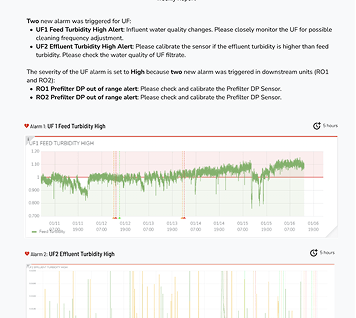
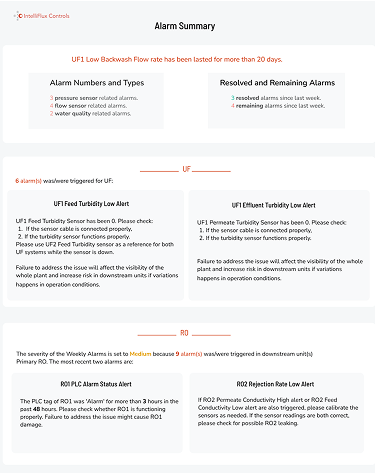
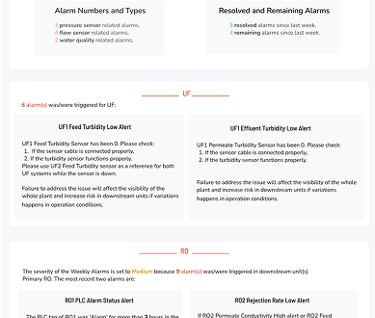
Used Grafana default dashboards as a various plant information including plant health, chemical requirements, alarm and other notifications, daily feedback, upstream and downstream that are for both operators and management level. Harder for different level of users to digest information and required customized interface that highlights important parts of plant health, alerts, production and cost notifications all combined as a digestible snapshot especially for the management level users. This resulted in low and high level alerts getting ignored or missed out by the operators, leading to a costly outcomes of management results.
Solution
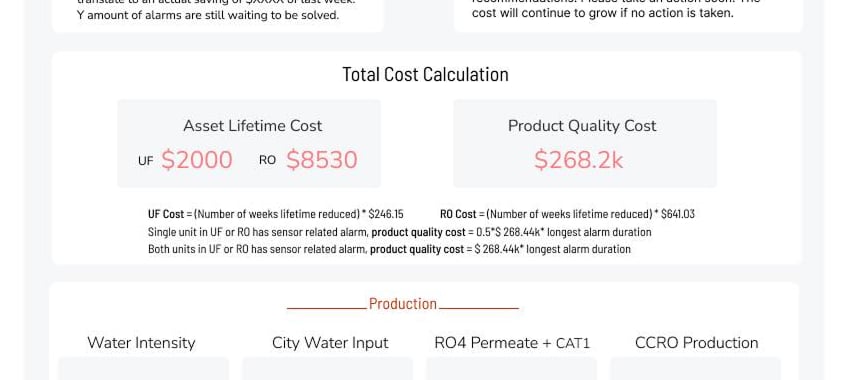
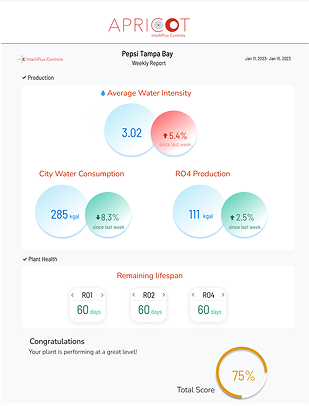
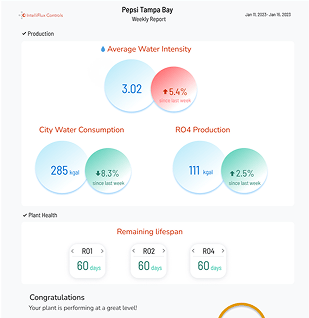
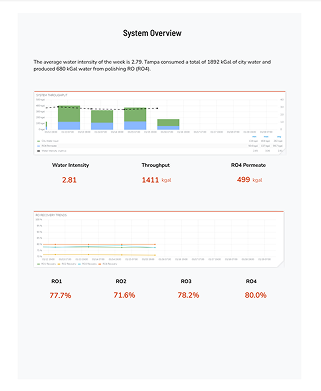
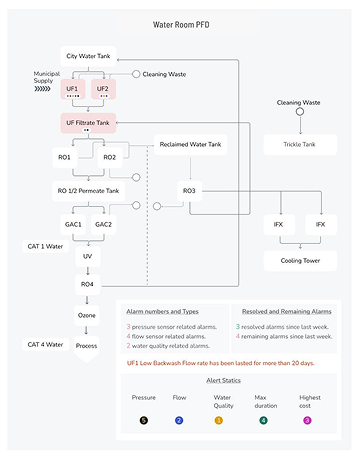
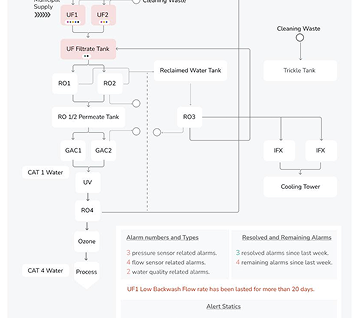
Consolidated important data on Grafana that were chosen accordingly through the results of user research of targeted users and projected tool interface outcomes. I complied the gathered research data, designed and developed a report-like interface, which also sends a pdf report to email and text as subscribed. The interface shows the real time production meters, plant health, cost and consumption reports. The software serves as a real time plant operation report that assists with plant management all from the Apricot software.
To establish this tool, I led the transition of raw process engineering data from our Grafana dashboards into a more intuitive, interactive reporting interface. This required extracting and structuring time-series plant data, then mapping it into a user-friendly digital dashboard. I designed and implemented the HTML/CSS front-end, ensuring clarity and responsiveness, while collaborating closely with the development team to integrate JavaScript, APIs, and SQL/NoSQL databases for real-time data flow. We also utilized Python for data processing and automation, along with REST APIs to connect plant sensors and AI-driven analytics. My role bridged UX design, front-end development, and data integration, turning complex engineering metrics into actionable insights for operators and executives.
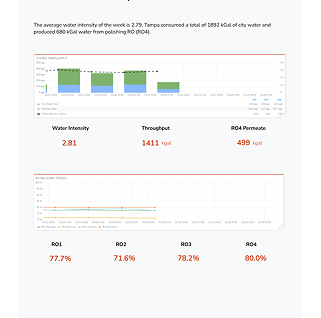
Initial Design Iterations

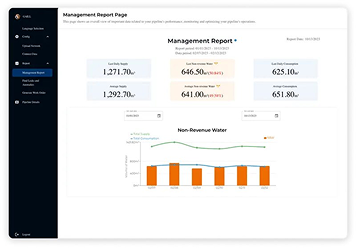
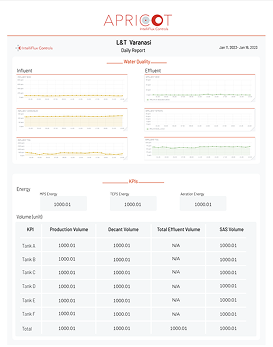
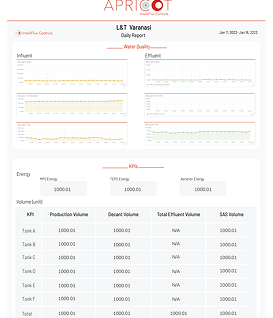
Adopted Version for GAILL by EFAS Tech
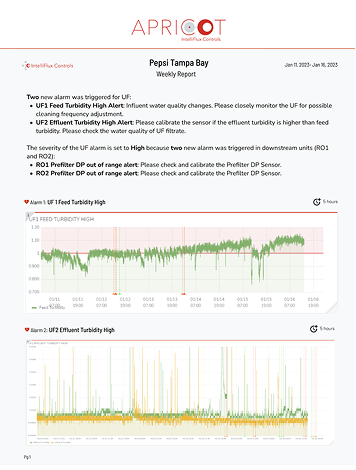
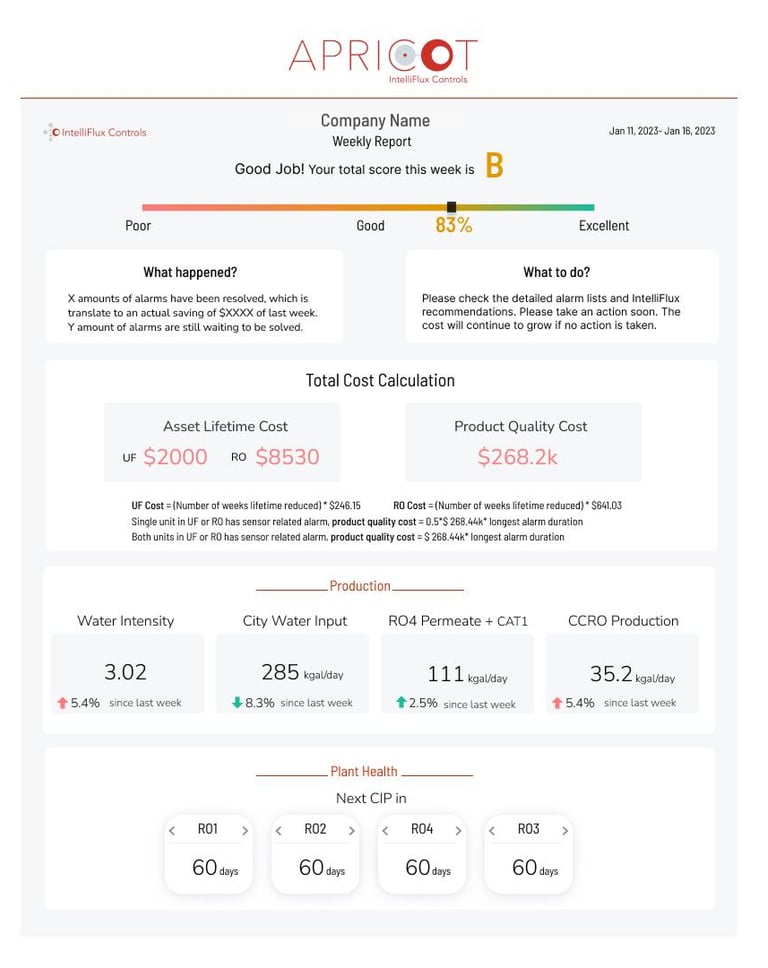
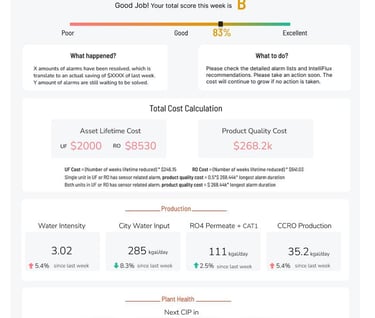
Final Version for Apricot by IntelliFlux Controls
Outcomes
The users: operators, plant managers and engineers receive real time reports that are user friendly and easily accessible.
Prevention of missing out all levels of alerts with suggested action and forecasted outcomes all in one place.
Promote online report accessibility that saves more in-person operation needs and stream-line the workflow.
Saves resources and up to millions of damage cost from missing alerts that require different level of attention and maintenance.
Prolonged the plant health and materials by following actionable suggestions. Currently used across the US and Asia through trusted fortune 500 companies.
Contacts
winsandyoo@gmail.com